How I Created the Salesforce Transit Center Roof Park 3D Diagram
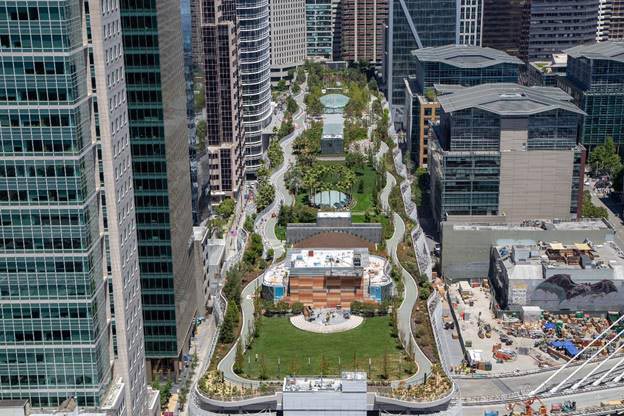
The Salesforce Transit Center roof park is one of the largest and diverse
roof parks in the world. Twelve distinct gardens feature hundreds of
species of plants from around the world. The park is an oasis suspended 60
feet above the noisy streets below. Within its 5.2 acres there are over 500
trees, a thousand-foot-long fountain, plaza, restaurant, children's play
area and more.
It took longer to draw the roof park 3D map than to build the Transit Center. It all started years ago on the streets of San Francisco.
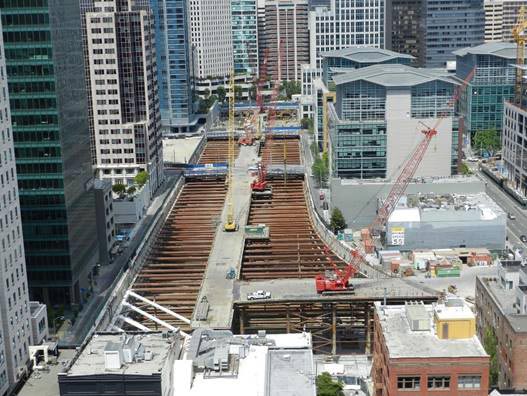
In early 2010, before construction on the Transit Center began, we faced
the daunting task of relocating all of the utilities in a five-block area.
The coming excavation of the lower levels of the Transit Center would
obliterate First, Fremont and Beale Streets. Sewer lines, high pressure gas
mains, power, water and countless other utilities had to be relocated in
one of the busiest corridors in the nation, the streets leading to the San
Francisco Oakland Bay Bridge. Careful coordination between the contractors,
the City of San Francisco and SF Muni were necessary. Otherwise, traffic to
the Bay Bridge would come to a halt.
At the time, I was working on the program management team creating maps to
track the progress of property acquisitions. The utility relocation
managers came to me and asked if I could create a map to help manage street
closures to move the utilities. I agreed to help and over the next couple
weeks I collected surveys, lane configuration diagrams, parking maps,
basically all the data I could get my hands on and merged them into a
detailed Street Coordination Map showing buildings, curbs, lane markings,
parking meters, overhead wires for electric buses, loading docks , even the
businesses and hours of operations. Every bit of information about who and
what would be impacted was captured. We had to make sure traffic kept
moving, buses ran on time, businesses stayed open, deliveries could be
made, and trash picked up. If we didn't keep everyone happy, they could
quickly shut down the project causing costly delays.
One thing I've learned over my 20 years as an engineer is never assume a drawing is correct just because it has a surveyor's or engineer's stamp on it. So, with my new map in hand I walked the streets with 100-foot measuring tape, a camera, and a red pen. I check measurements, curbs, lane markings - every detail making notes on my map until I had an accurate representation of the existing conditions.
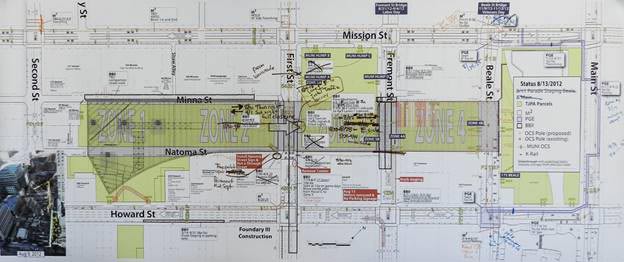
Each week we would meet and using a six-foot long print out of the Street Coordination Map that I drafted taped to a conference room wall. We would walk each street, block by block working out which lanes would be closed, which would be kept open, what, when and who would do the work. I plotted every detail of the work on the map. If traffic would be impacted too negatively we'd have to come up with alternative plans. I would update the map and email it to all the contractors to coordinate their work, to the City of San Francisco to issue street closure permits, SF Muni so they could adjust their bus operations and our public outreach team for neighborhood notifications.
In August 2010 we began demolition of the old Transbay Terminal and the Bus Viaducts. Since these elements spanned several streets, the progress of the demolition work was added to the Street Coordination Map.
A year later we added elements of the Transit Center to the Street Coordination Map as construction had commenced. The next major disruption was the complete replacement of First, Fremont and Beale streets with bridges as the massive excavation for the lower levels of the Transit Center progressed. Nearly all of that work for the bridges was done, as traffic continued to flow. As the excavation began to outline the footprint of the Transit Center, a new type of illustration was taking shape.
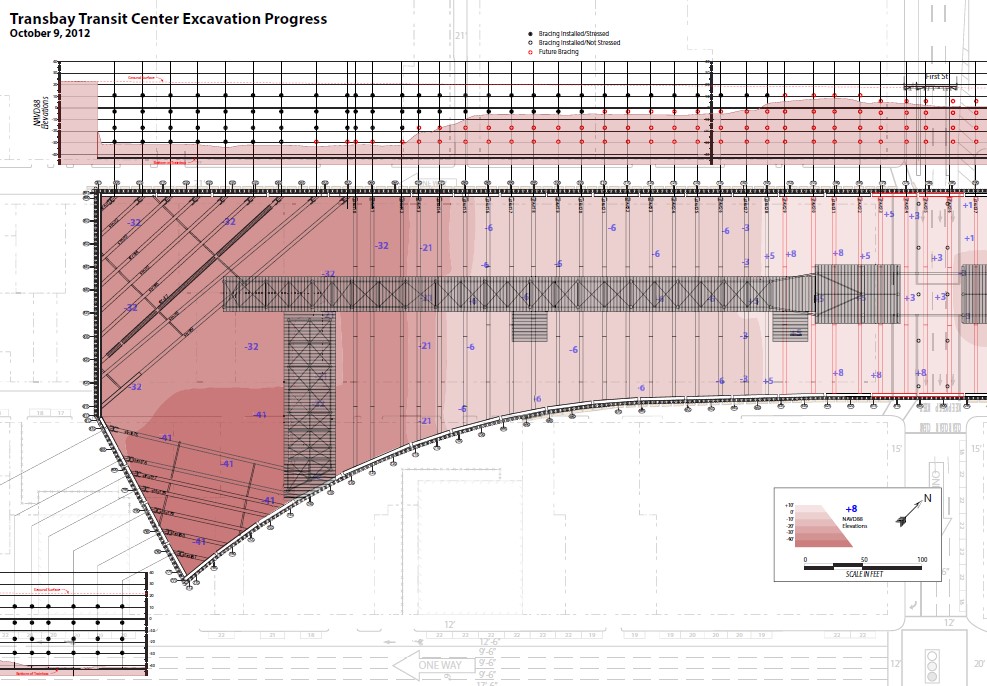
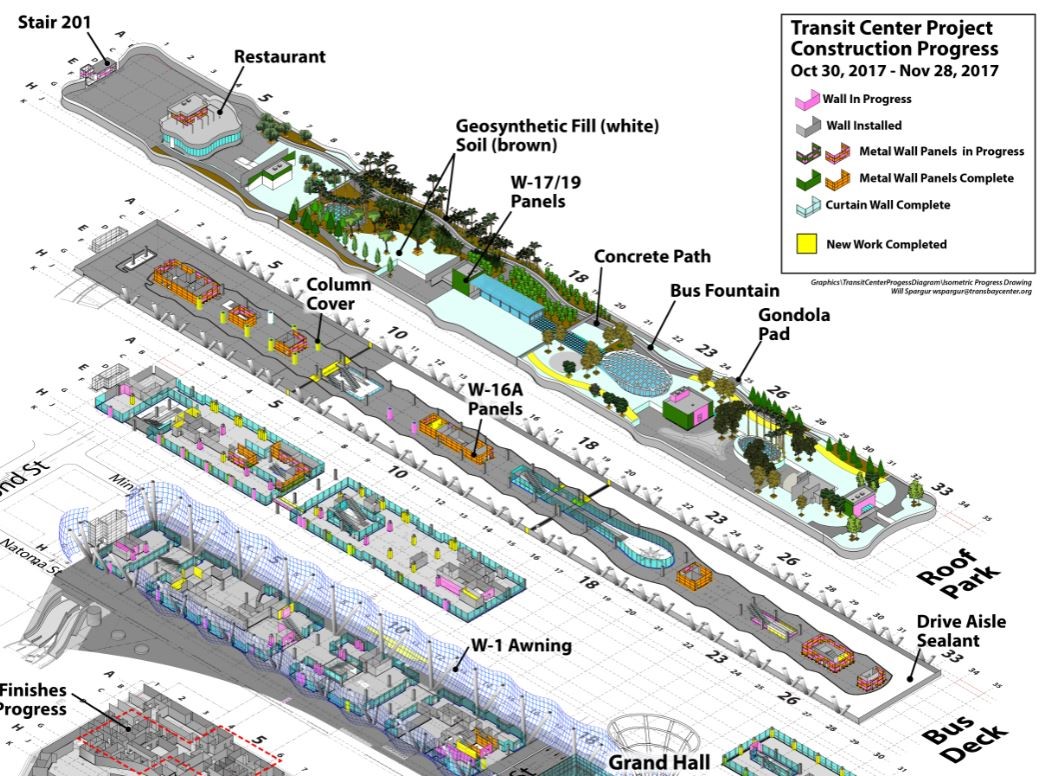
Since the Transbay Joint Powers Authority (TJPA) is a public agency, it is required to make regular reports to the public. Each month it issues a progress report and holds public meetings at City Hall. Because of the project's size and complexity, it was challenging to convey the progress of the work to an audience with a mix of technical and non-technical people using PowerPoint bullet lists or photos. We had to create a visual of the Transit Center construction progress which could be quickly understood in a glance.
I realized that Street Coordination Map already showed part of the Transit Center work. With a few modifications we could accurately show overall progress in a simple, easy-to-understand format, focusing on a few key aspects of the construction while also not trying to represent every little detail. The resulting Construction Progress Diagrams immediately became a staple of the TJPA's public presentations and reports.
Once the underground structure was complete the public could now see the structural steel elements rising from the ground and the Construction Progress Diagram underwent a complete make over. In place of the two-dimensional map, I created a 3D stacked isometric diagram to show work completed on all levels at once.
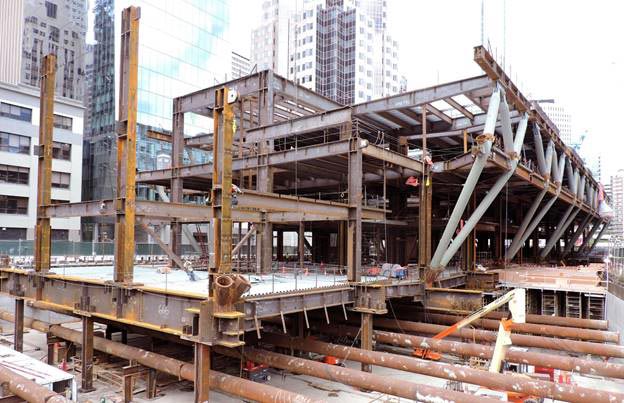
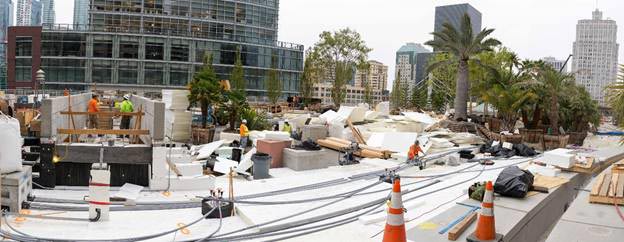
By the end of 2016, we had topped off the structural steel and work began on building up the roof park landscaping. The buildup of the roof park landscape was a big change. Today, when visitors walk the path or climb small hills, few realize the landforms beneath their feet were built up using foam blocks layered five or more feet thick then covered with a foot of soil.
Then late at night, on January 17, 2017, a flatbed truck arrived with three trees. A crane on the roof swung its arm over the side and lowered a hook. The very first trees for the roof park had arrived. I recorded this progress on the Construction Progress Diagram by drawing a simple, generic tree. The park was starting to look like a park.
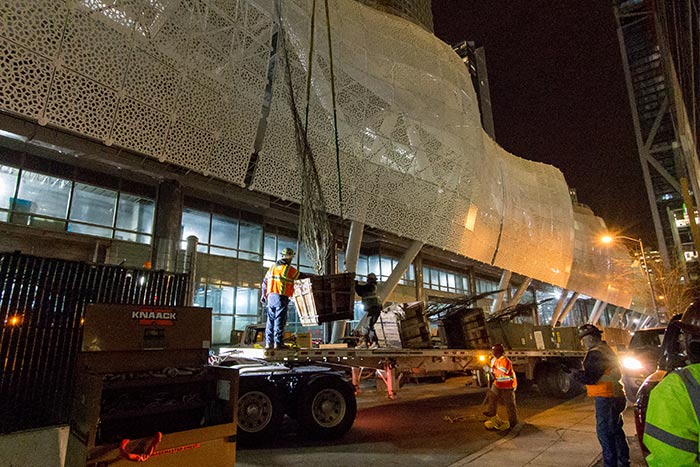
For the next two years, late every night and into the early morning,
flatbed trucks would roll down the deserted streets of San Francisco to the
Transit Center to deliver a load of trees. The sizes and variety of
deliveries was amazing including Chilean Wine Palms, Monterey Cypress,
Mediterranean Fan Palms, Monkey Puzzle Trees, California Buckeye, Coast
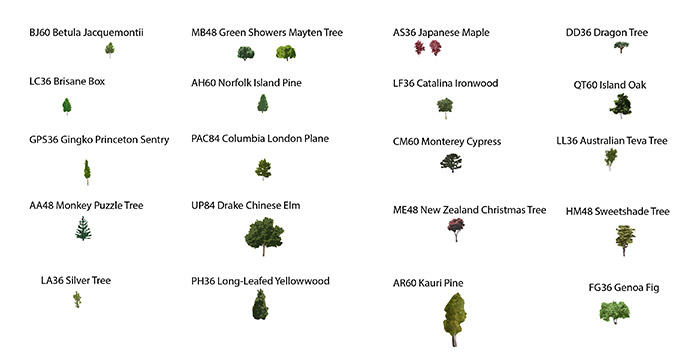
Live Oak, Coast Redwoods, and many more. I realized that the generic trees
I was using in the Construction Progress Diagram did not do justice to what
was taking shape in the field. I studied the landscape drawings noting all
the different species of trees, searching the internet for photos and then
going on site to the roof park to see if I could identify the trees as they
were being placed. I started creating simple vector diagrams of each
species replacing the generic trees with the new drawings. Now the
Construction Progress Diagram was in sync again with the park construction.
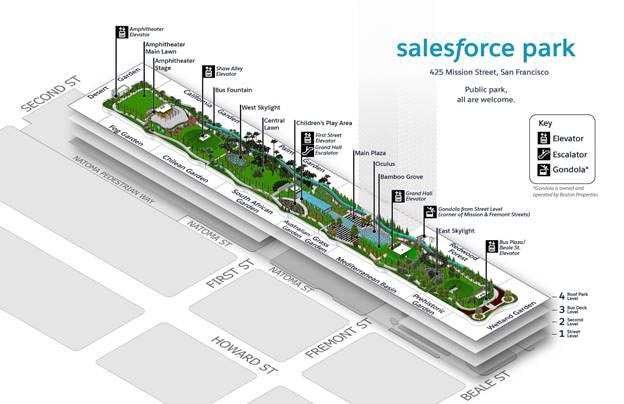
Faithfully representing the dozens of varieties and hundreds of trees that were being placed on the rooftop park takes a lot of work. Fortunately, it also takes a long time to deliver 500 trees. This broke the work into bite size chunks making the diagram much easier to create. Once a month I would walk the park documenting what new trees had arrived, taking pictures, marking their locations and update the Construction Progress Diagram accordingly. On July 1st 2018, after 9 years of documenting the construction progress, I issued my final construction progress diagram, which included a the rooftop park trees, fountains, plazas, and all.
As construction entered the final stretch in 2018, preparations for the opening the park to the public were underway. Everyone who went up to the park was in awe of what had been created. It was an otherworldly experience walking the tranquil path through the myriad of gardens knowing 60 feet below your feet were the busy, noisy streets of San Francisco. The commissioning team wanted a map that could show visitors the plethora of amenities available. Since the Construction Progress Diagram showed every detail of the park in unprecedented detail the commissioning team asked if I could tweak the diagram for use as a guide for visitors to the park. When the Transit Center Roof Park reopened on July 1st 2019, this map, which took eight years to make, will guide visitors through this magical garden.